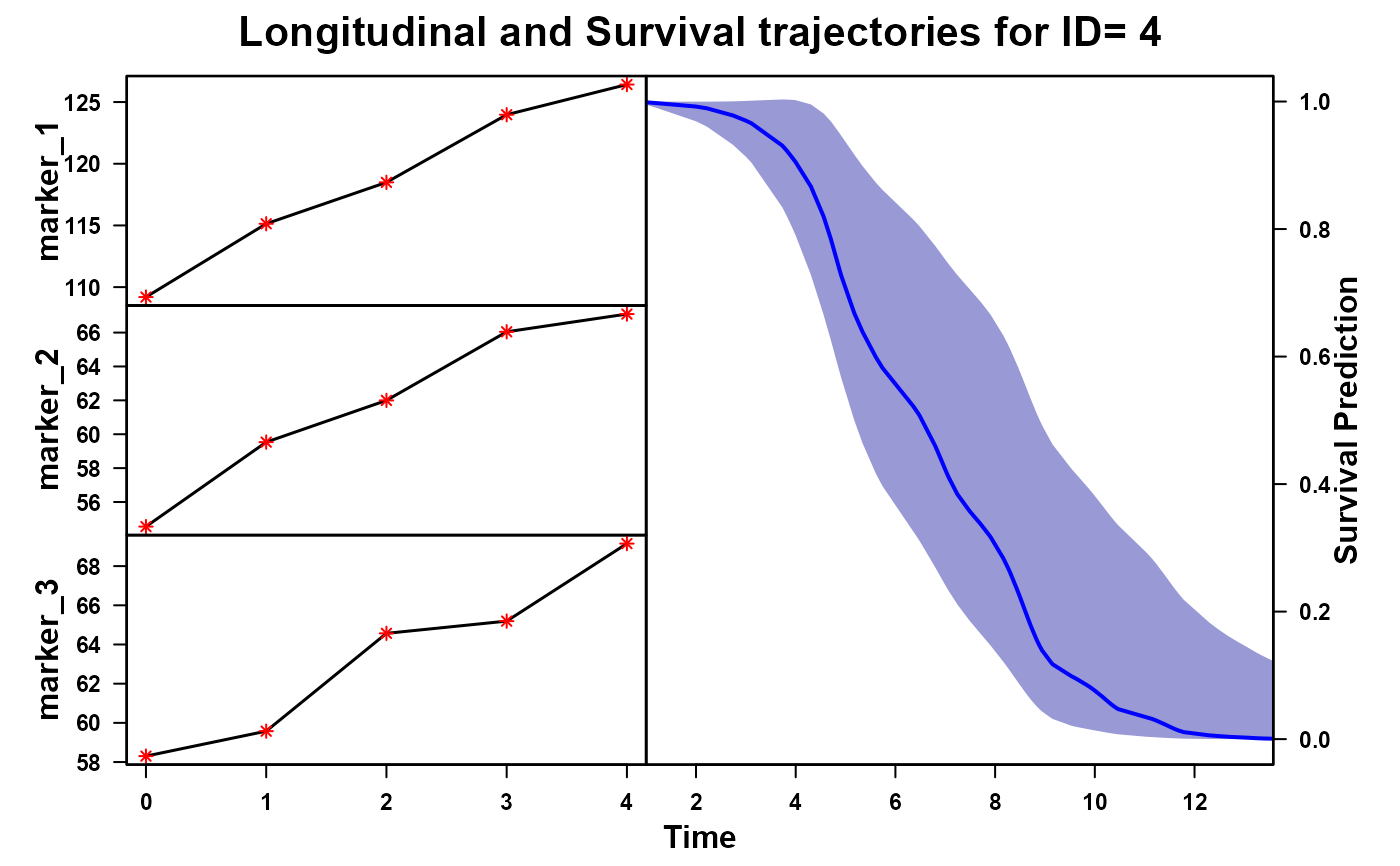
Plot Longitudinal and Survival Predictions from a Two stage Joint Model
plot_jmtwostage.RdThis function generates a plot combining longitudinal marker trajectories and survival probability estimates from a fitted joint model.
plot_jmtwostage(
  fitted.object,
  newdata = NULL,
  nimp = 1,
  id = NULL,
  marker = TRUE
)
Arguments
- fitted.object
A fitted object of JMtwosatge package.
- newdata
A data frame containing new covariate values for prediction. Defaults to `NULL`.
- nimp
An integer specifying which imputed dataset to use (for multiple imputation models). Defaults to `1`.
- id
A specific ID for which survival and marker trajectories should be plotted. Defaults to `NULL`.
- marker
Logical; if `TRUE`, includes longitudinal markers in the plot. Defaults to `TRUE`.
Value
A plot displaying the survival function along with longitudinal marker trajectories.
Details
The function extracts survival estimates from the joint model and overlays them with longitudinal marker values for an individual, if `id` is provided. It supports models fitted using multiple imputation.
Examples
library(survival)
model_wMI<- jmwMI(ldata=long_data,
                  sdata=surv_data,
                  timeDep=c("marker_1","marker_2","marker_3"),
                  impModel=list(marker_1~Z_1+Z_2+Time+(1|ID),
                                marker_2~Z_1+Z_2+Time+(1|ID),
                                marker_3~Z_1+Z_2+Time+(1|ID)),
                  ipwModel=list(~Z_1+Time+(1|ID),
                                ~Z_1+Time+(1|ID),
                                ~Z_1+Time+(1|ID)),
                  visitTime="Time",
                  coxModel=Surv(survival_time,survival_status)~Z_1+Z_2+
                  td(marker_1)+td(marker_2)+td(marker_3),
                  model="Cox",id="ID")
#> boundary (singular) fit: see help('isSingular')
plot_jmtwostage(fitted.object = model_wMI,id=4)