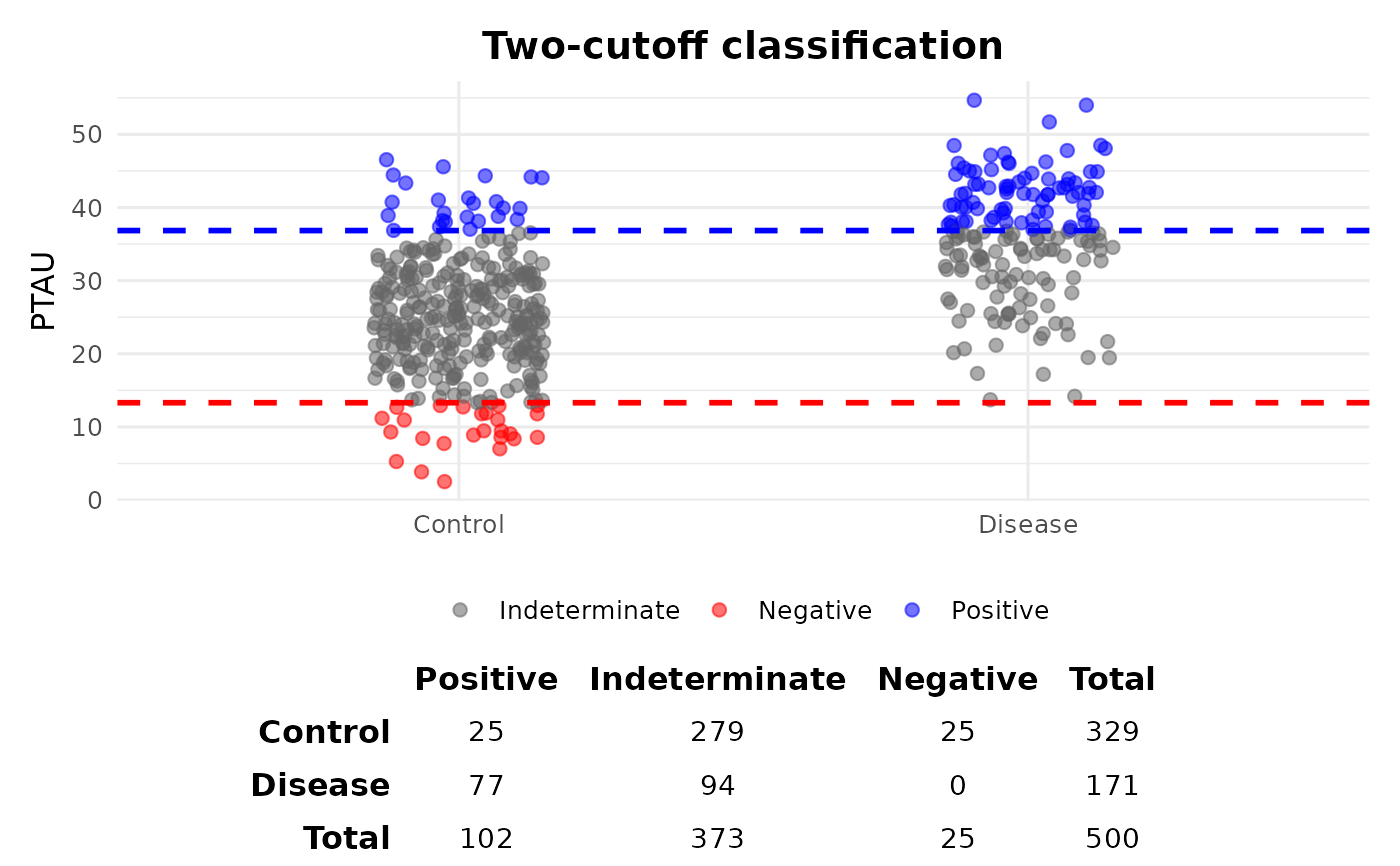
Visualizes biomarker values with rule-out and rule-in cutoffs, using results from percentile-based or ROC-based cutoff functions.
Usage
plot_two_cutoff(
  cutoff_result,
  biomarker,
  outcome,
  panel_title = NULL,
  negative_label = "Control",
  positive_label = "Disease",
  ylab = NULL,
  add_table = NULL,
  point_alpha = 0.55
)
Arguments
- cutoff_result
Output list from
derive_cutoffs_percentile()orderive_cutoffs_sensspec(), containing:c_L: lower cutoff (rule-out threshold)c_H: upper cutoff (rule-in threshold)data: dataset including biomarker and outcome
- biomarker
Character, name of biomarker column.
- outcome
Character, name of binary disease outcome column (0/1).
- panel_title
Optional character vector of panel titles.
- negative_label
Label for non-diseased group (default = "Control").
- positive_label
Label for diseased group (default = "Disease").
- ylab
Y-axis label (default = "Plasma biomarker").
- add_table
Logical, whether to add confusion table below plot (default = NULL).
- point_alpha
Numeric, transparency for points (default = 0.55).
Details
Subjects are classified as:
Negative (rule-out): biomarker <
c_LPositive (rule-in): biomarker >
c_HIndeterminate: between
c_Landc_H
The plot shows jittered biomarker values by true group, with horizontal
dashed lines indicating the rule-out (c_L) and rule-in (c_H) thresholds.
Points are colored by predicted classification.
Examples
n <- 500
set.seed(123)

# outcome
DISEASE <- rbinom(n, 1, 0.35)

# biomarker depends on disease
PTAU <- rnorm(n, mean = 25 + 10 * DISEASE, sd = 8)

# confounders (optional noise)
AGE <- round(rnorm(n, 73, 7))
SEX <- sample(c(0, 1), n, replace = TRUE)
BMI <- rnorm(n, 25, 4)
HTN <- rbinom(n, 1, 0.3)
DM <- rbinom(n, 1, 0.2)

df <- data.frame(PTAU, AGE, SEX, BMI, HTN, DM, DISEASE)

res <- adjust_score(
df,
biomarker = "PTAU",
outcome = "DISEASE",
confounders = c("AGE","SEX","BMI","HTN","DM"))
#> number of iterations= 704
#> Setting levels: control = 0, case = 1
#> Setting direction: controls < cases

cutoffs <- derive_cutoffs_percentile(res, biomarker = "PTAU")
#> Number of cases below low_thresh = 0.05 is too small, so fallback to 5th percentile of biomarker was used. Consider using another low_thresh value if your dataset is small.
plot_two_cutoff(cutoffs, biomarker = "PTAU", outcome = "DISEASE")